Dashboard \ CLARAfi

Understanding the Problem
As a UX Designer at CLARAfi, I was responsible for understanding the needs of our users (small business owners) and designing solutions to meet those needs. Through extensive user research and testing, I was able to gain a deep understanding of the pain points and frustrations users were experiencing with the current dashboard design. I then worked closely with the development team to implement design solutions that improved the overall user experience, such as simplifying navigation, increasing the visibility of important information, and streamlining the interface. Additionally, I implemented a user feedback loop to continuously gather insights and make iterative improvements to the dashboard. The end result was a website dashboard that was more intuitive and user-friendly, resulting in increased satisfaction and productivity for the users.
Research
To better understand the demands of the dashboard users, I used a variety of research methodologies. Initially, I performed one-on-one interviews with a number of users to learn about their requirements, problems, and pain spots with the present dashboard. For some of the feature implementations, I used online surveys to collect data from a large number of users post-launch. I conducted usability testing throughout ideation to monitor people interacting with the dashboard and asking them to accomplish certain activities in order to uncover usability concerns and get input on the design.

Sketch
The initial sketch I designed were intuitively low-fidelity representations of the layout and functionality of the dashboard. I started by identifying the key elements of the dashboard, such as the navigation menu, data visualizations, and controls, that are necessary to achieve the desired user experience. Then, I organized the layout of the dashboard, deciding on the placement of the key elements, and how they will interact with each other. Through iteration from user testing, I refined the wireframe and moved to the prototype.
Design
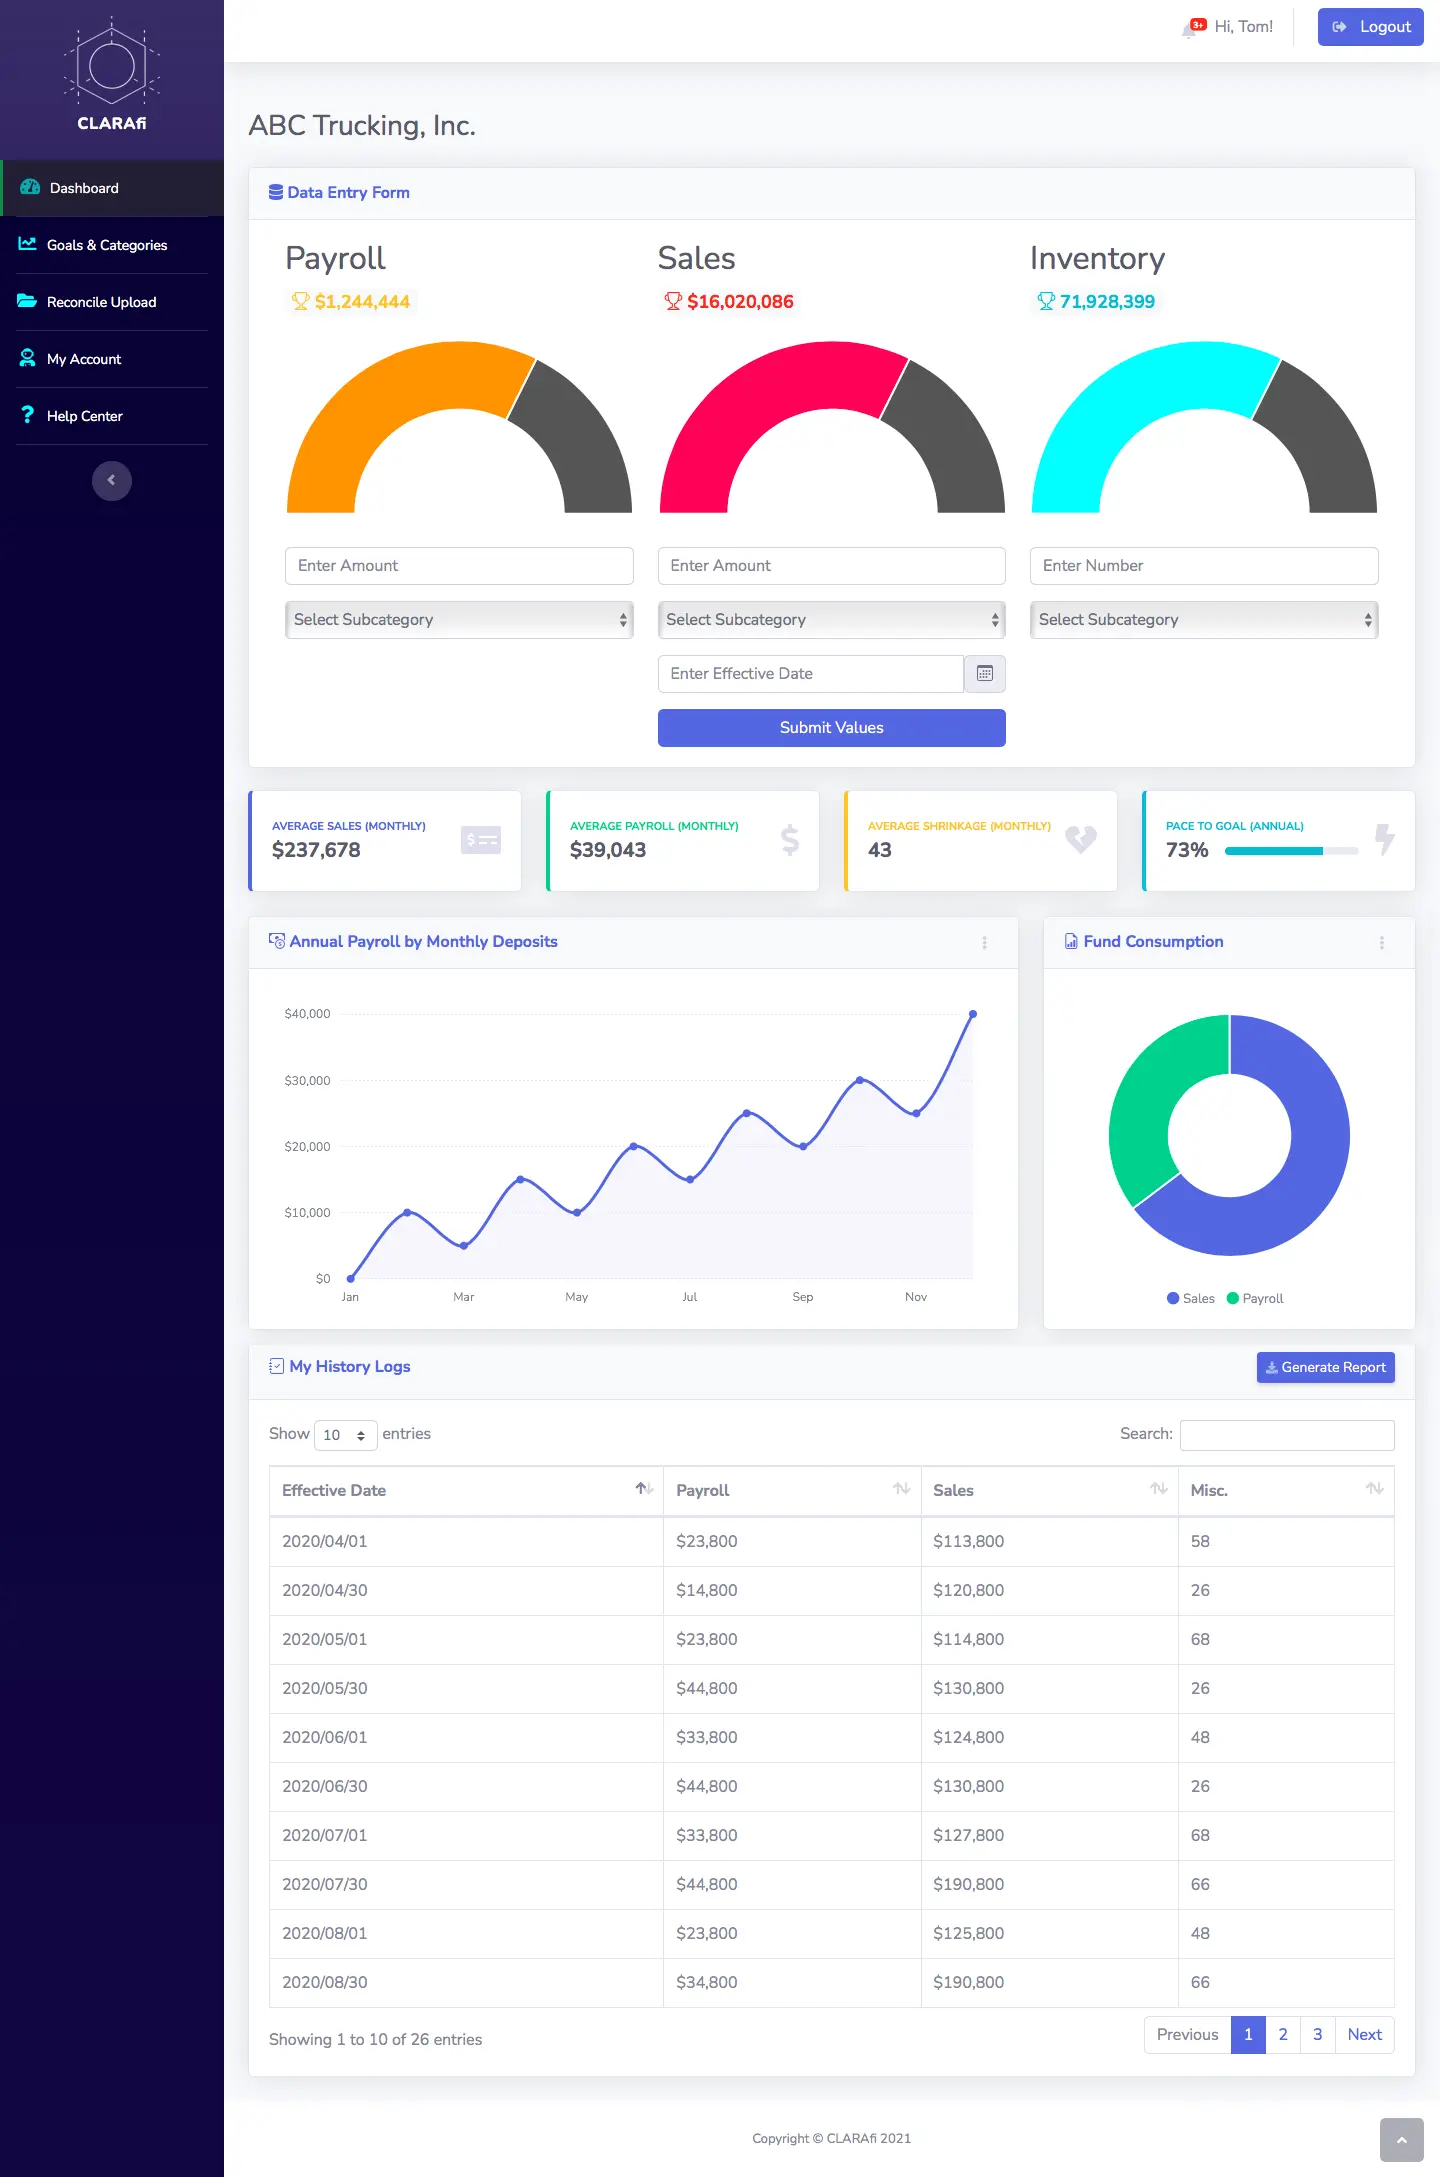
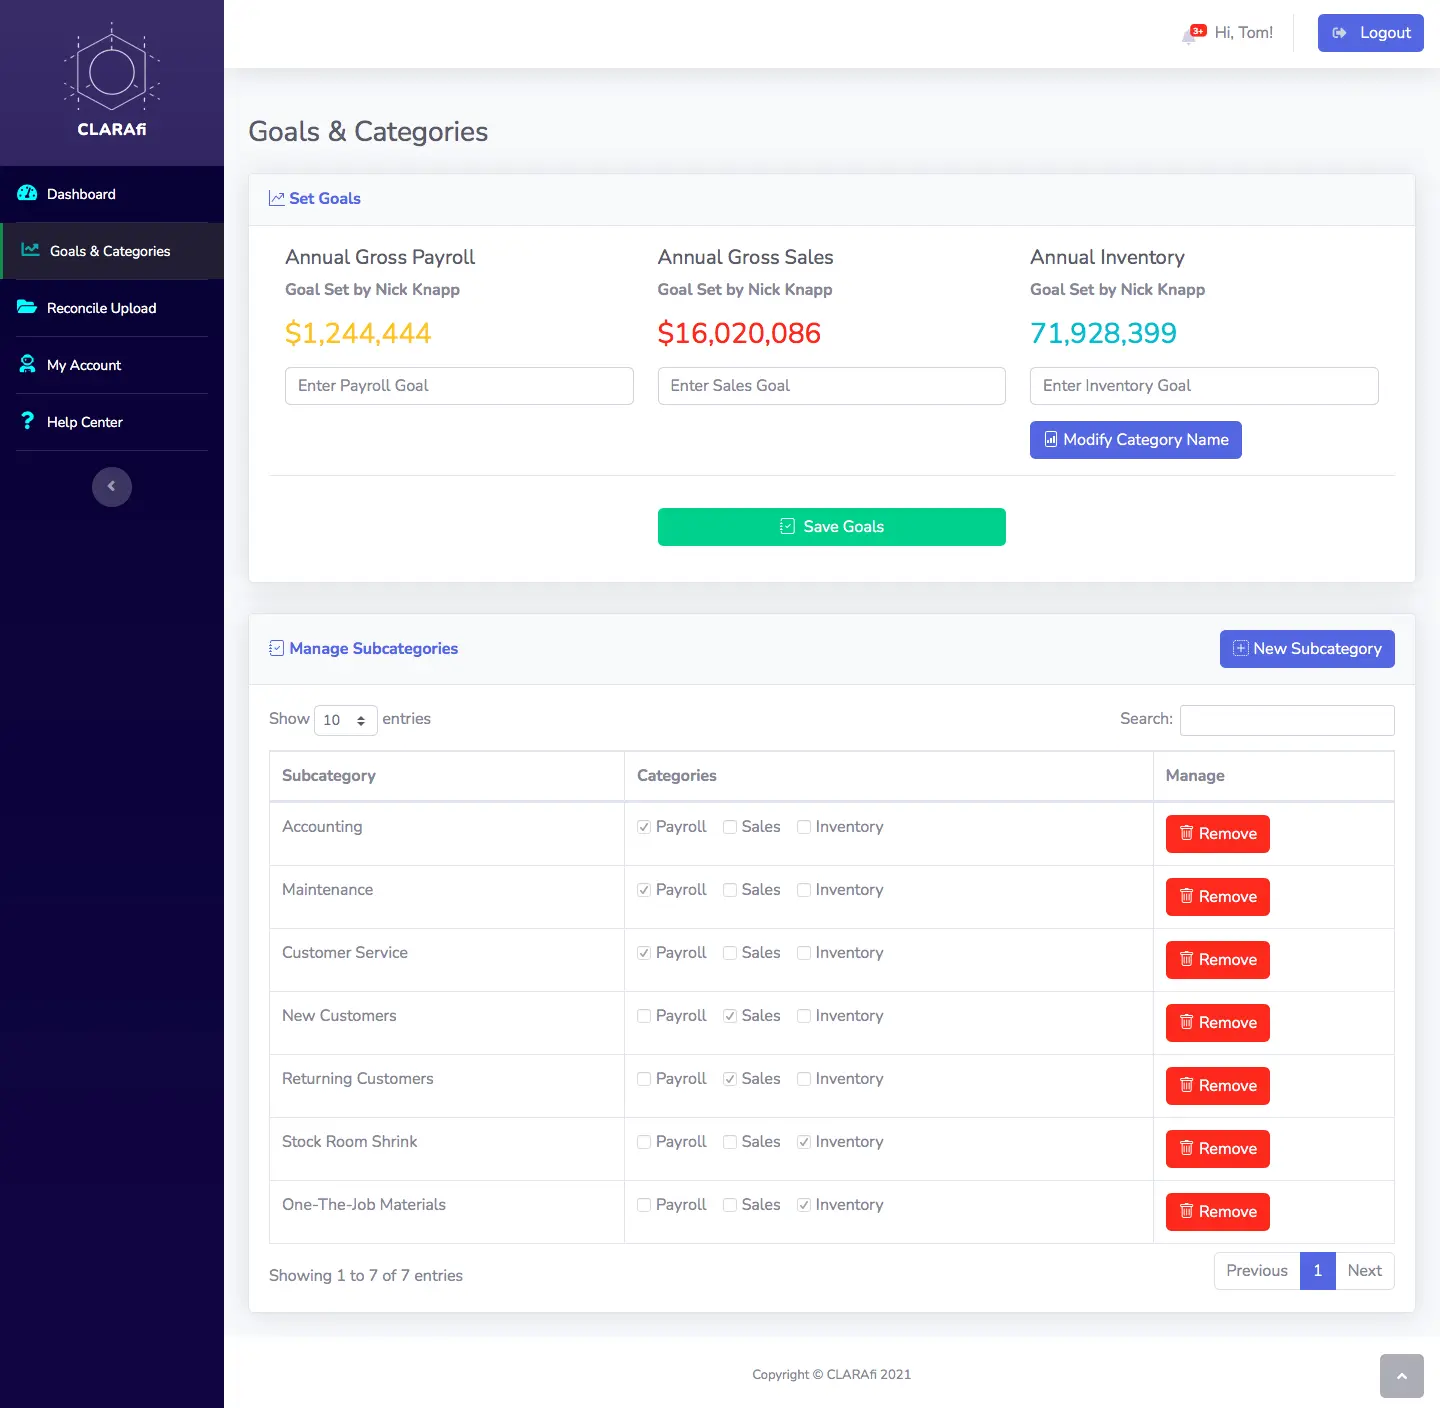
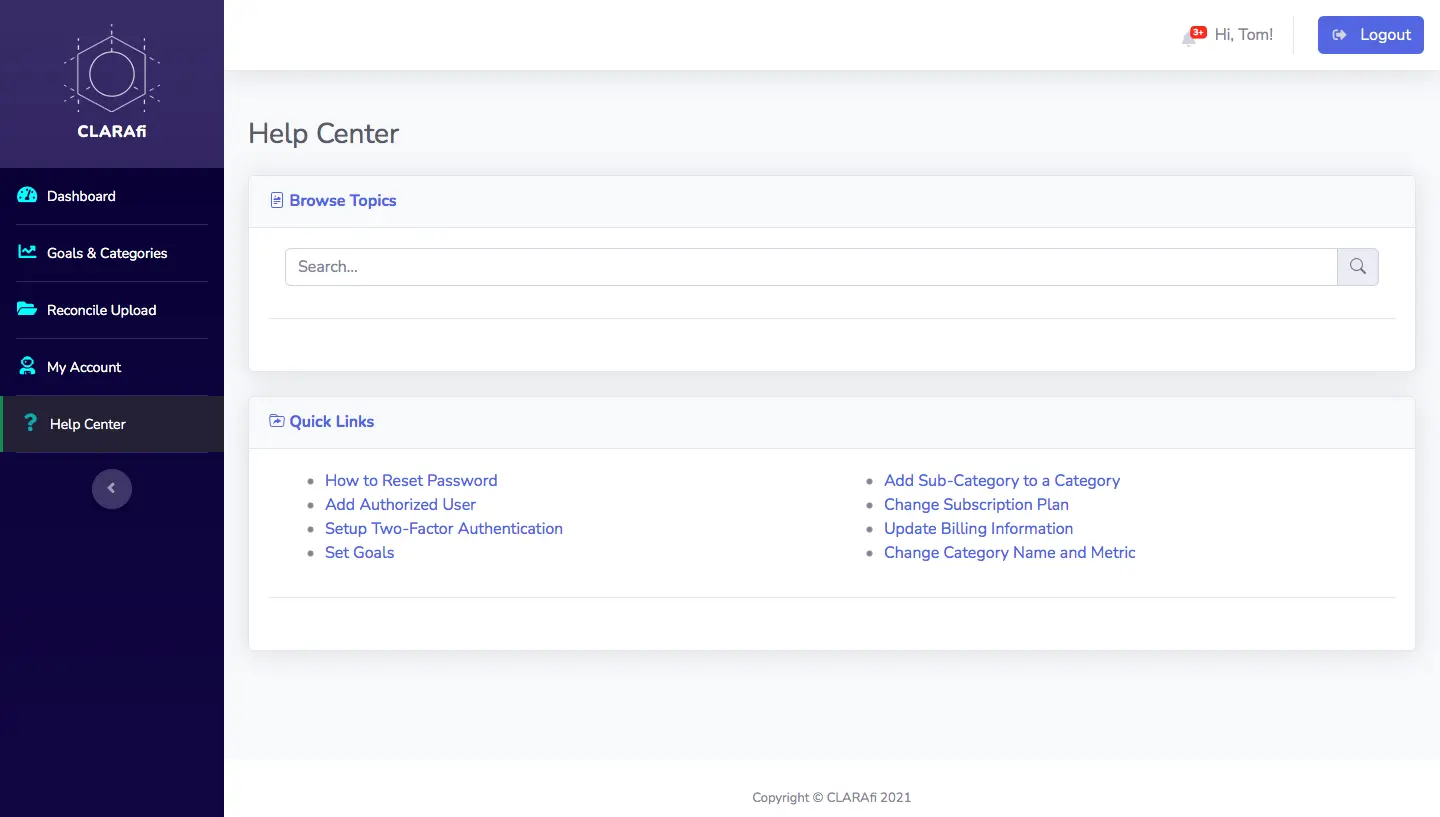
The dashboard effectively uses design elements such as color, typography, layout, and white space to create a pleasant and engaging user experience. The dashboard uses color effectively which creates a mood, as well as guides the user's attention to important elements. The layout is well-designed with easy-to-navigate actions, and a sense of hierarchy. The first-time user follows a series of screens to set their initial goals, and review business information. The main dashboard screen shows the progress to goals with a visual representation, along with a table view of document history. Ultimately, a visually stunning website is one that integrates design components efficiently to produce a unified and engaging user experience that is consistent with the company's brand and messaging.
Implement
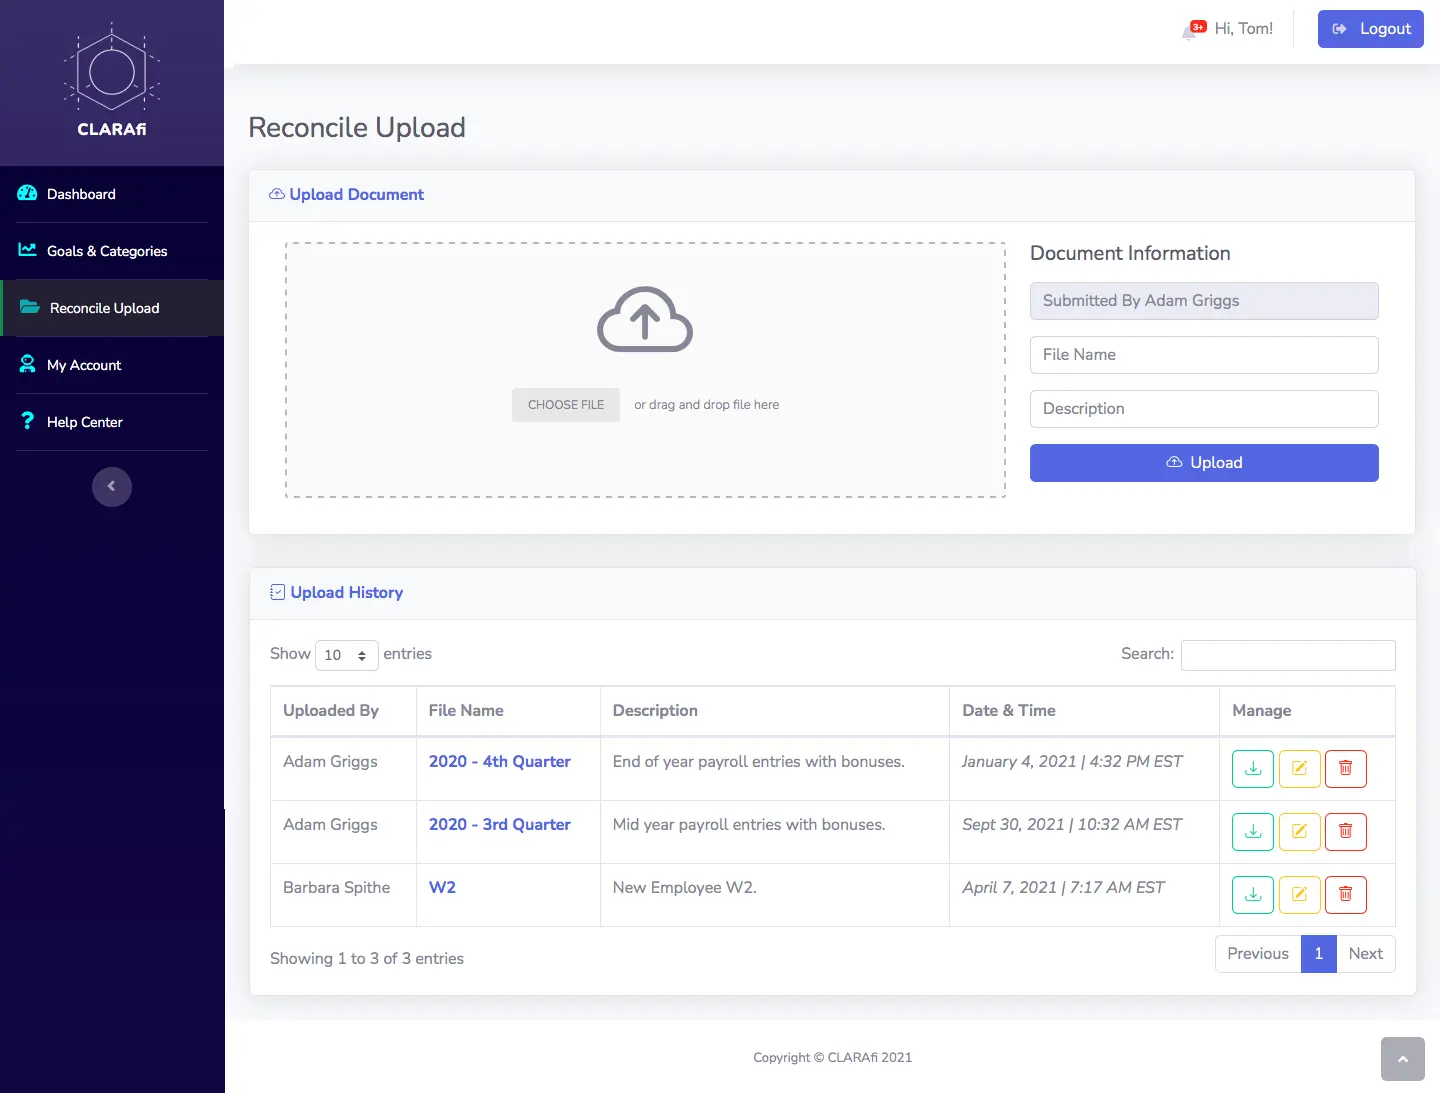
Gathering feedback from stakeholders, ensuring that the design met the business goals and objectives. The team approach we chose was an agile development environment that relies on cross-functional teams that include the developers, stakeholders, and me, who worked together throughout the development process to ensure that the product meets the needs of the users. Upon launch, this project started making an impact on business owners as quickly as they could sign up. I have heard testimonials from owners where they were able to save money on their insurance premiums because of the main dashboard features, and tracked metrics. The business owner can assign authorized users (accountants, insurance agents, etc.) to view accurate data.
Conclusion
Based on feedback from users, and metrics such as user engagement and retention, I conclude that the user experience was intuitive and easy to use, making it easy for users to find the information they needed and complete their desired tasks. I still work closely with the CEO to better enhance and design new features. This project continues to be a collaboration, and iteration process. The dashboard is visually appealing and engaging, creating a positive user experience.
View Next Case Study


